How to Analyze Your Website with GTmetrix + Make Improvements
by Aaron Janes, Founder
If your a business owner, and you want to learn the same strategies that I use to grow my business and my clients, then sign up for my newsletter.

GTmetrix is one of the go-to tools for measuring your website's speed and functionality, and it's a fantastic way to look over your website and see what needs to be improved. Better improvements mean a better user experience and higher rankings on Google.
But how are you actually supposed to use the app? What does it all mean?
We all know the pains of waiting for an endlessly slow website to load, and there's no way you want to put your customers in the same position. GTmetrix can help identify the problems, but without knowing what you're doing, you may as well be reading hieroglyphics.
I'll walk you through everything today, helping you make the most of what GTmetrix offers and hopefully helping you get your website to exactly where it needs to be.
Let's get started.
What is GTmetrix?
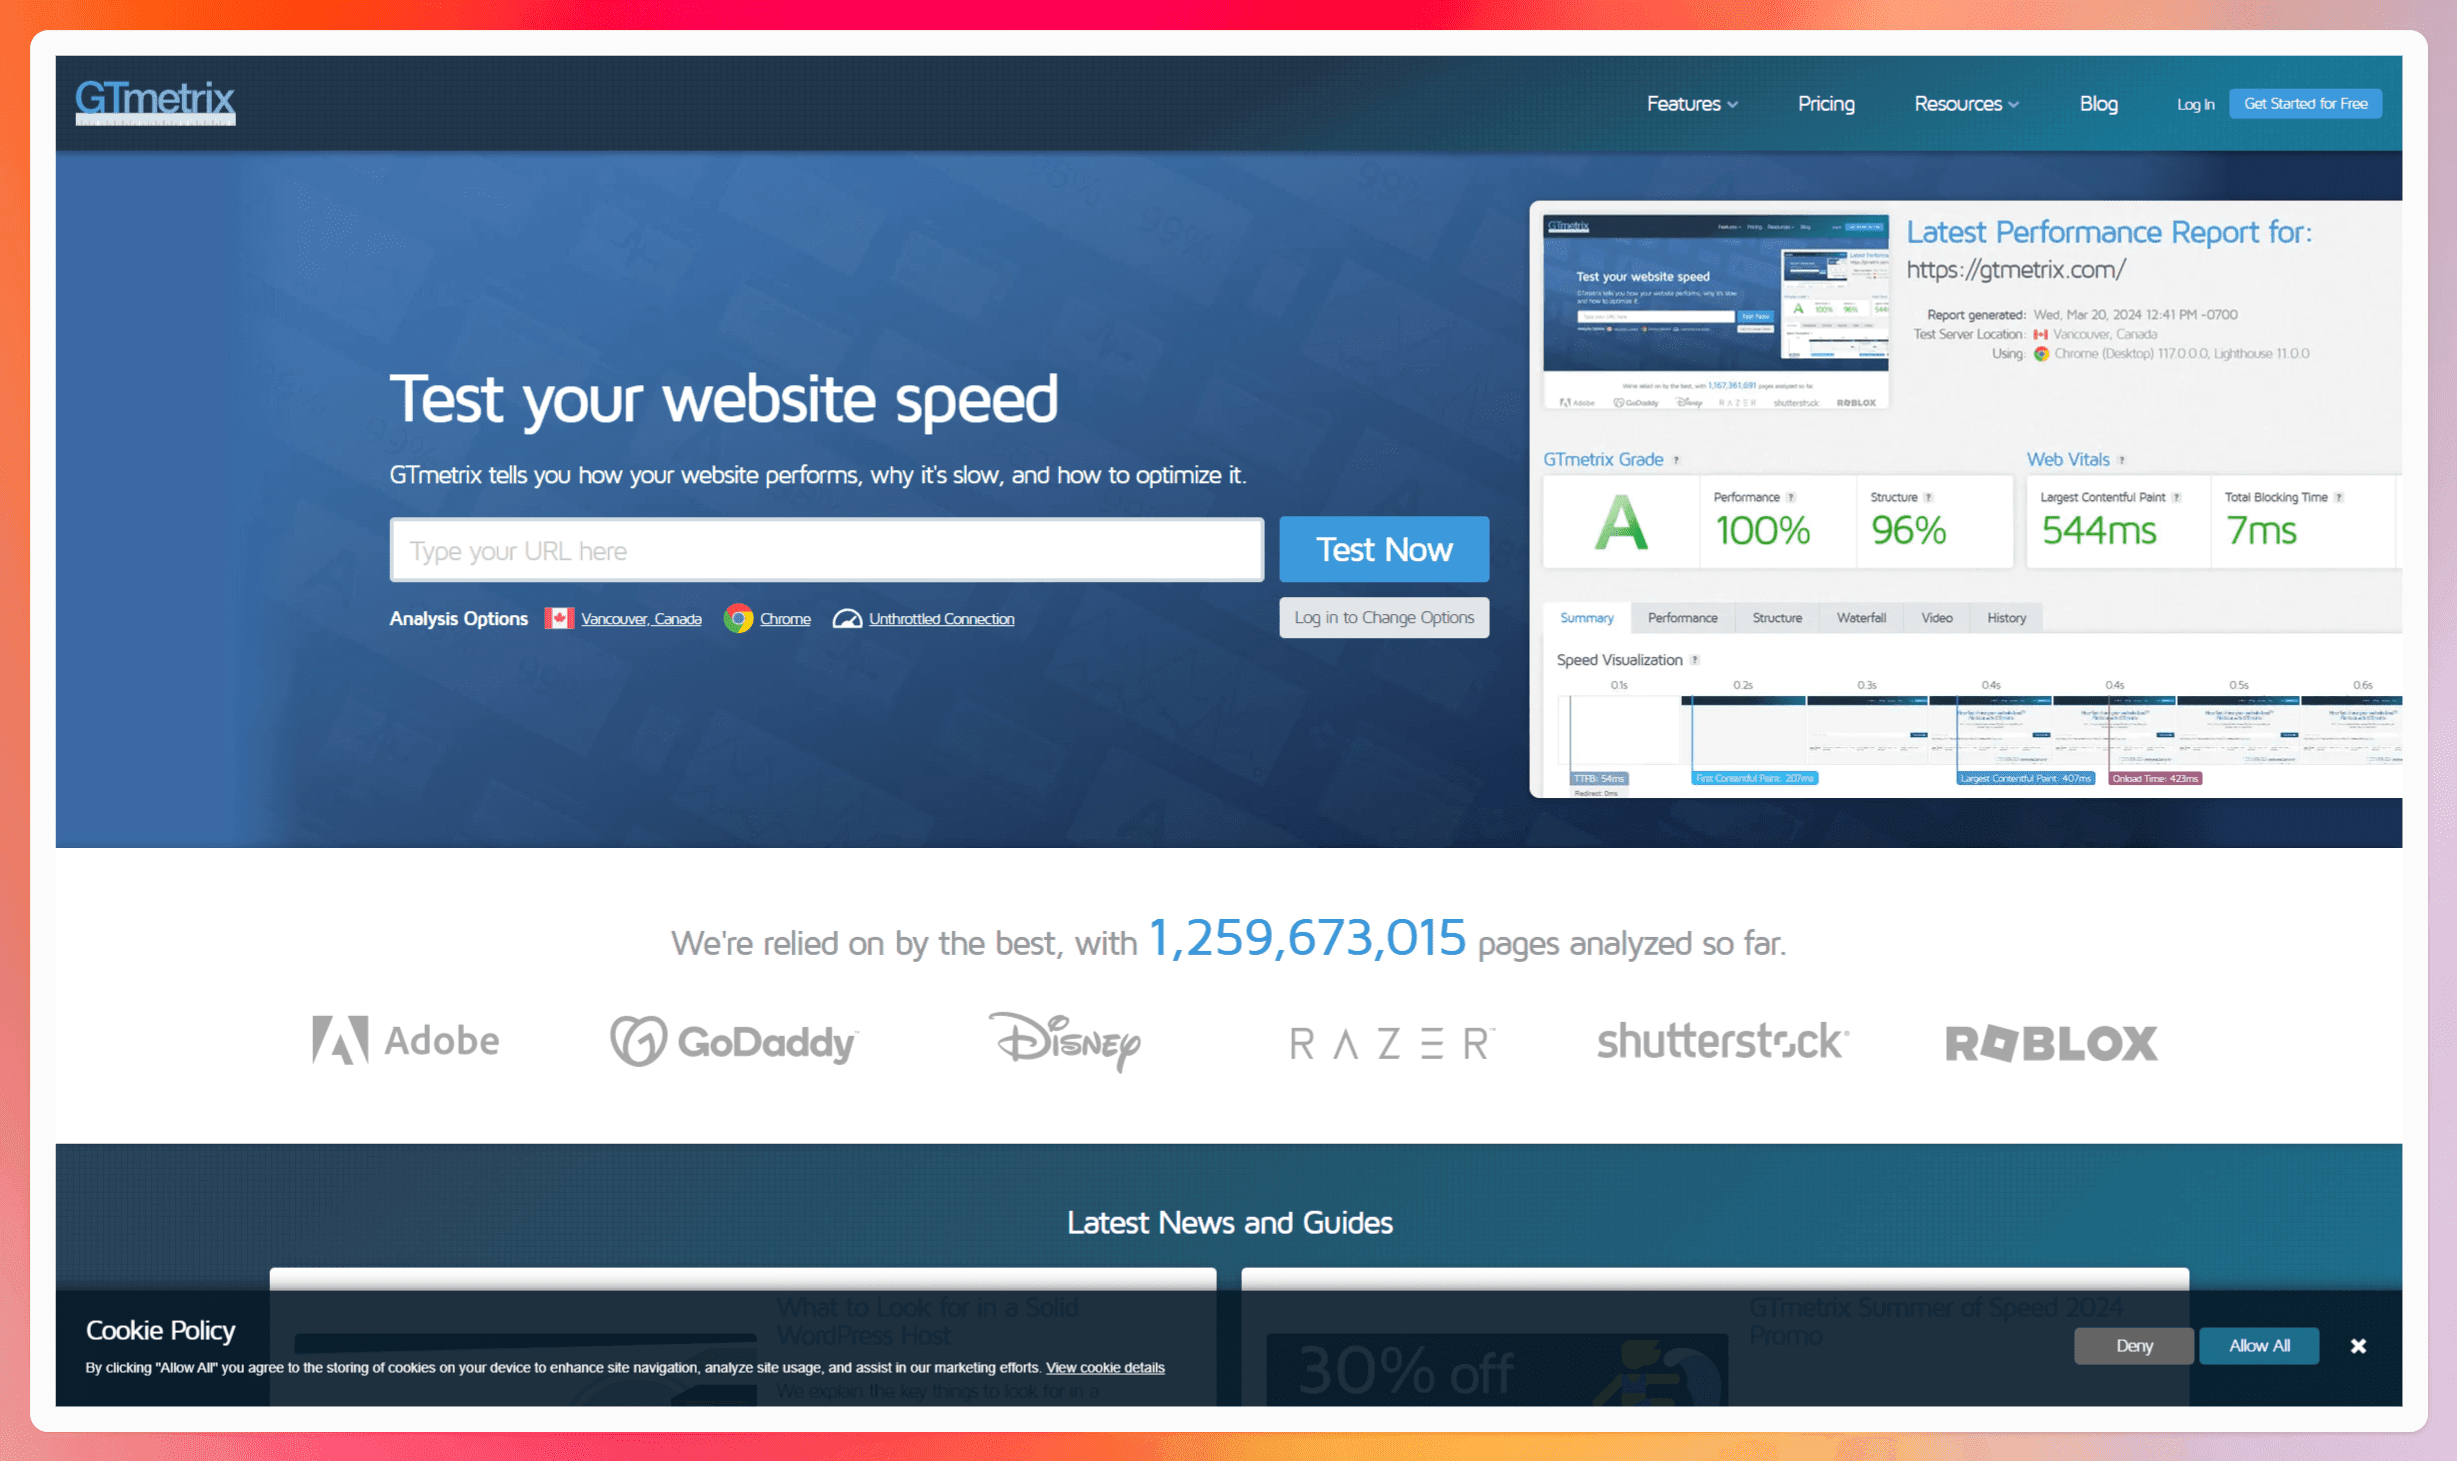
GTmetrix is a powerful online tool that analyzes your website's performance. Think of it as a digital doctor giving your website a thorough check-up.
GTmetrix works by simulating a real user's experience, loading your website and generating a detailed report. You can choose variables like your device and internet speeds to see exactly how a user would experience your site.
After running a few tests, you'll receive a report packed with valuable information, including performance scores, waterfall charts (we'll get to those in a bit!), and actionable recommendations.
But why should Edmonton businesses care about GTmetrix?
Well, in a city as vibrant and competitive as ours, a fast-loading website is crucial for attracting and retaining customers. Whether you're running an online store, a restaurant, or a professional services firm, GTmetrix can help you ensure your website is performing at its best.
Let's take a peek under the hood.
Understanding the GTmetrix Report
Now, let's get to the heart of the matter: the GTmetrix report. At first glance, it might seem a bit overwhelming, but don't worry, I'm here to break it down for you.
I've searched cafes in Edmonton cafes and taken the first on the list. This time, it's Little Bricks.
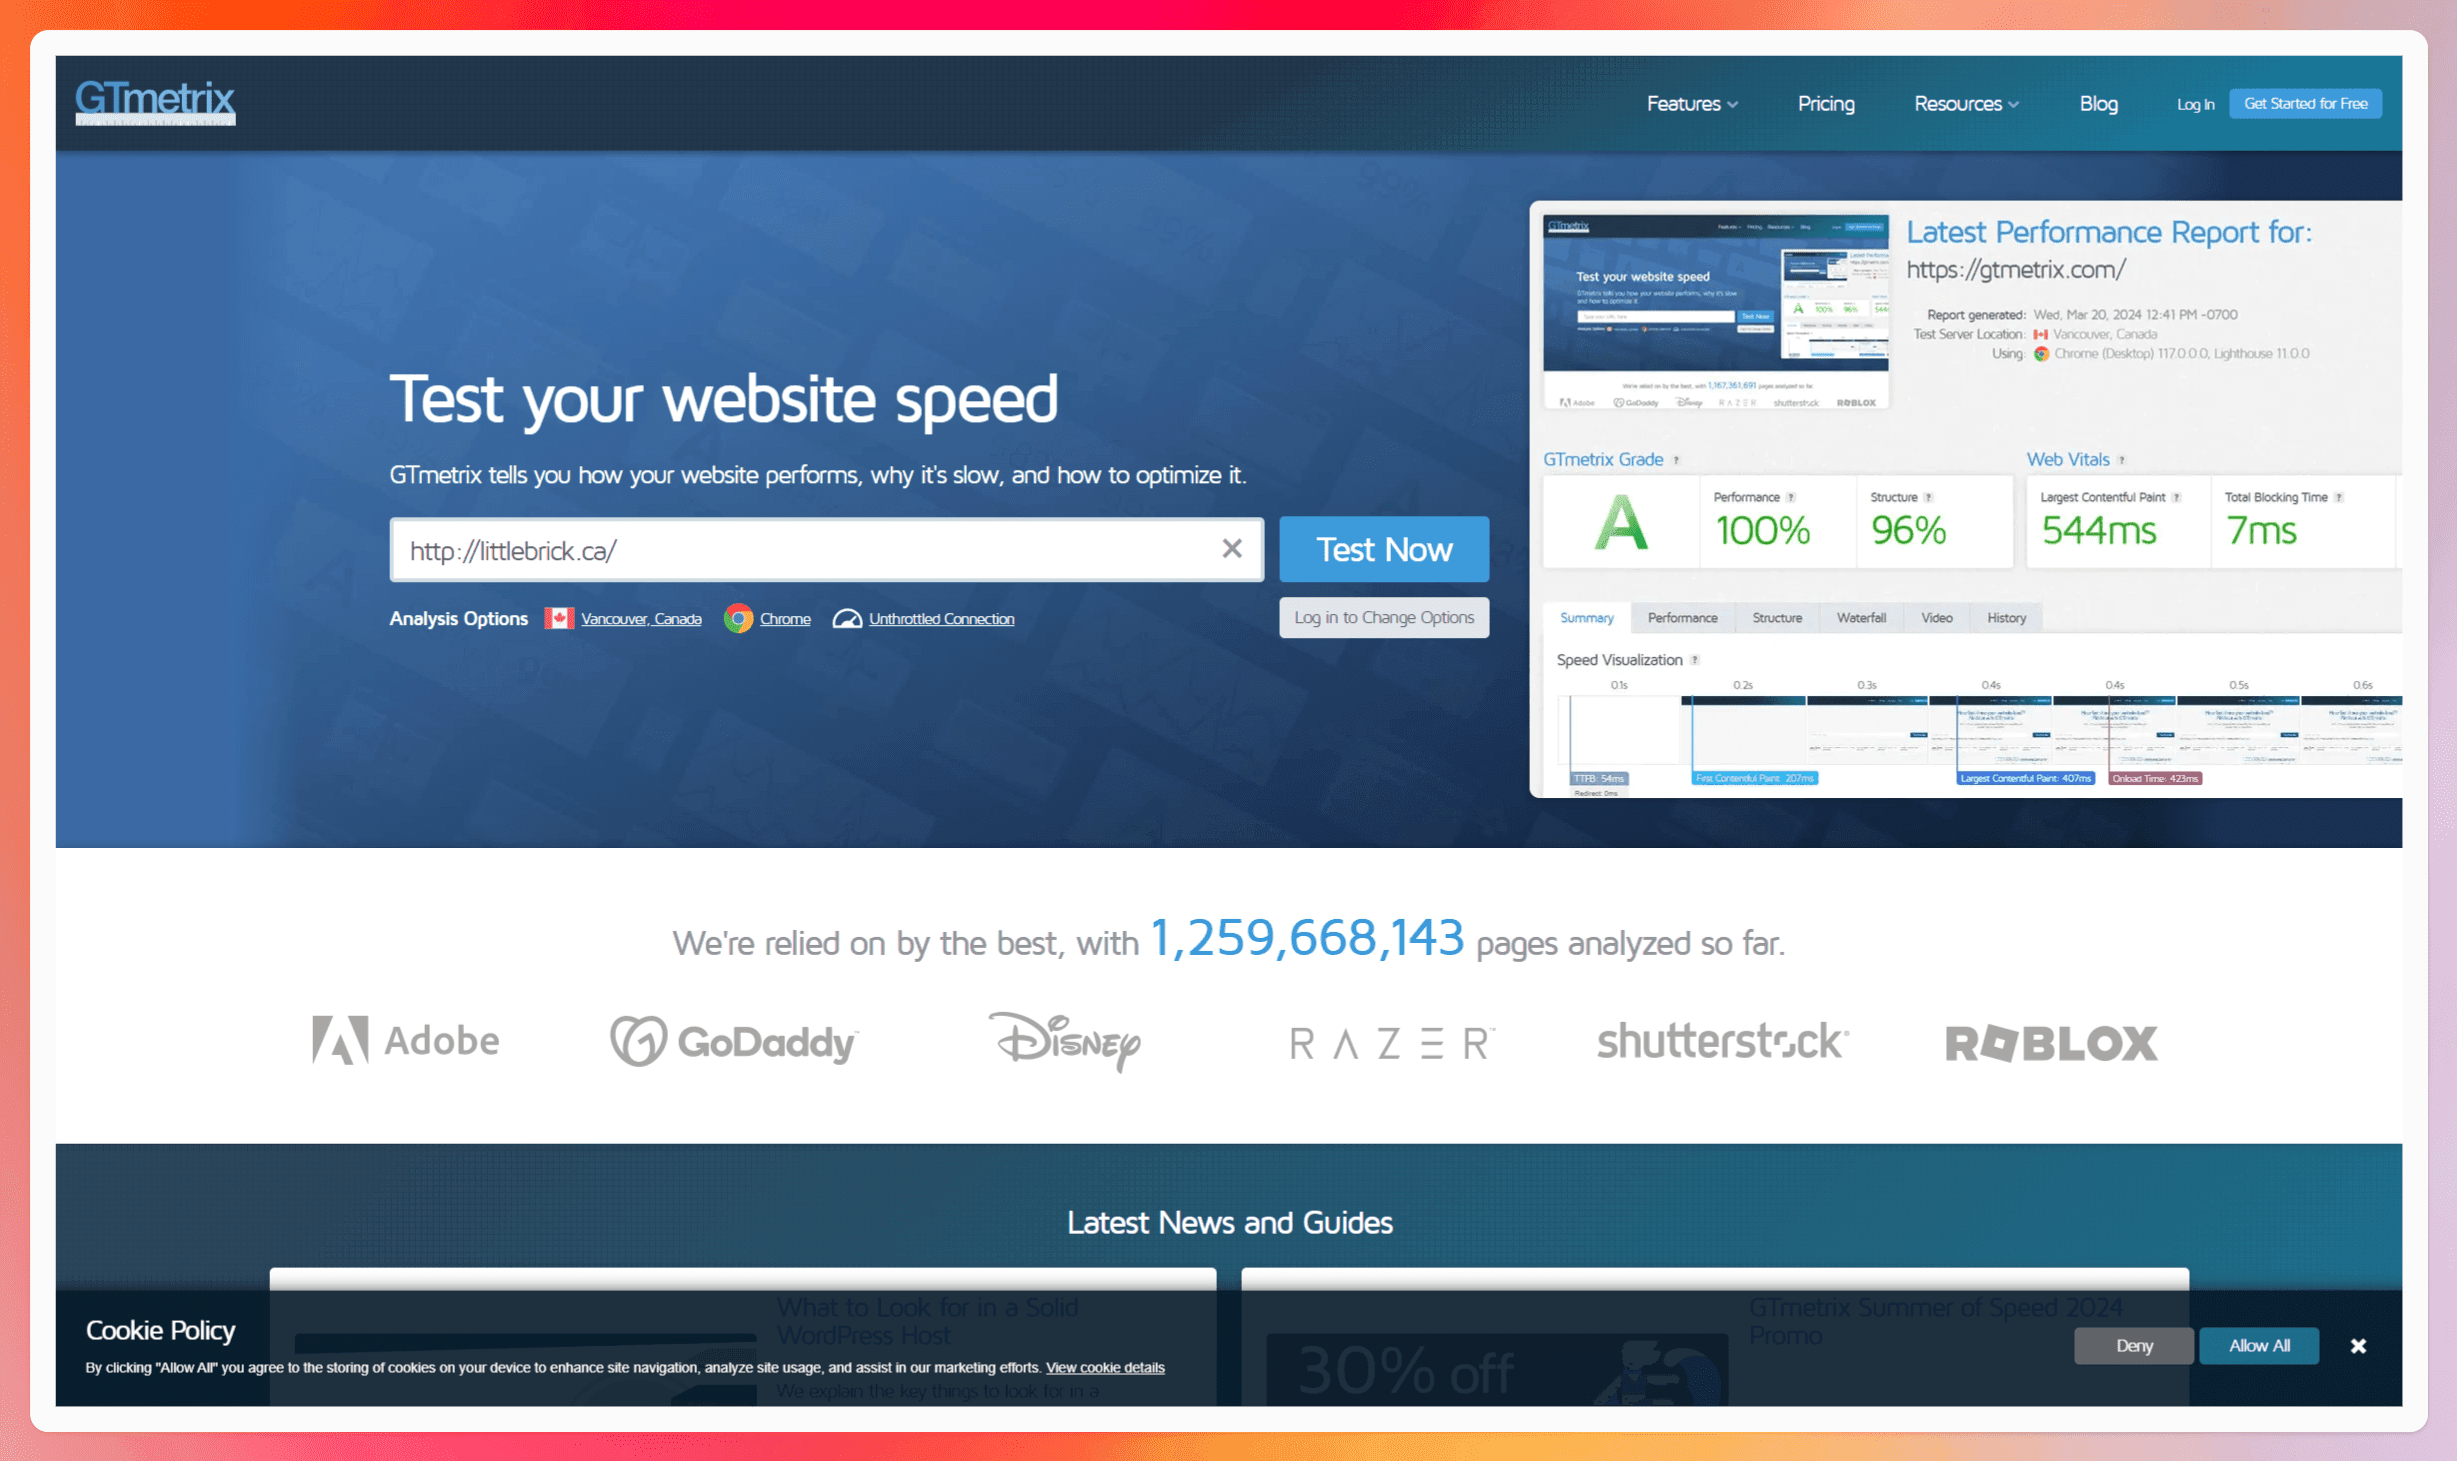
First, run the test. Head over to GTmetrix and plug in your URL. For a general test, keep the default settings (found under the search bar). The test will usually take a few minutes.
When finished, you'll get a report that looks like this. If you're not signed up and using a free account, many metrics will be blocked, but you can still get a rough idea.
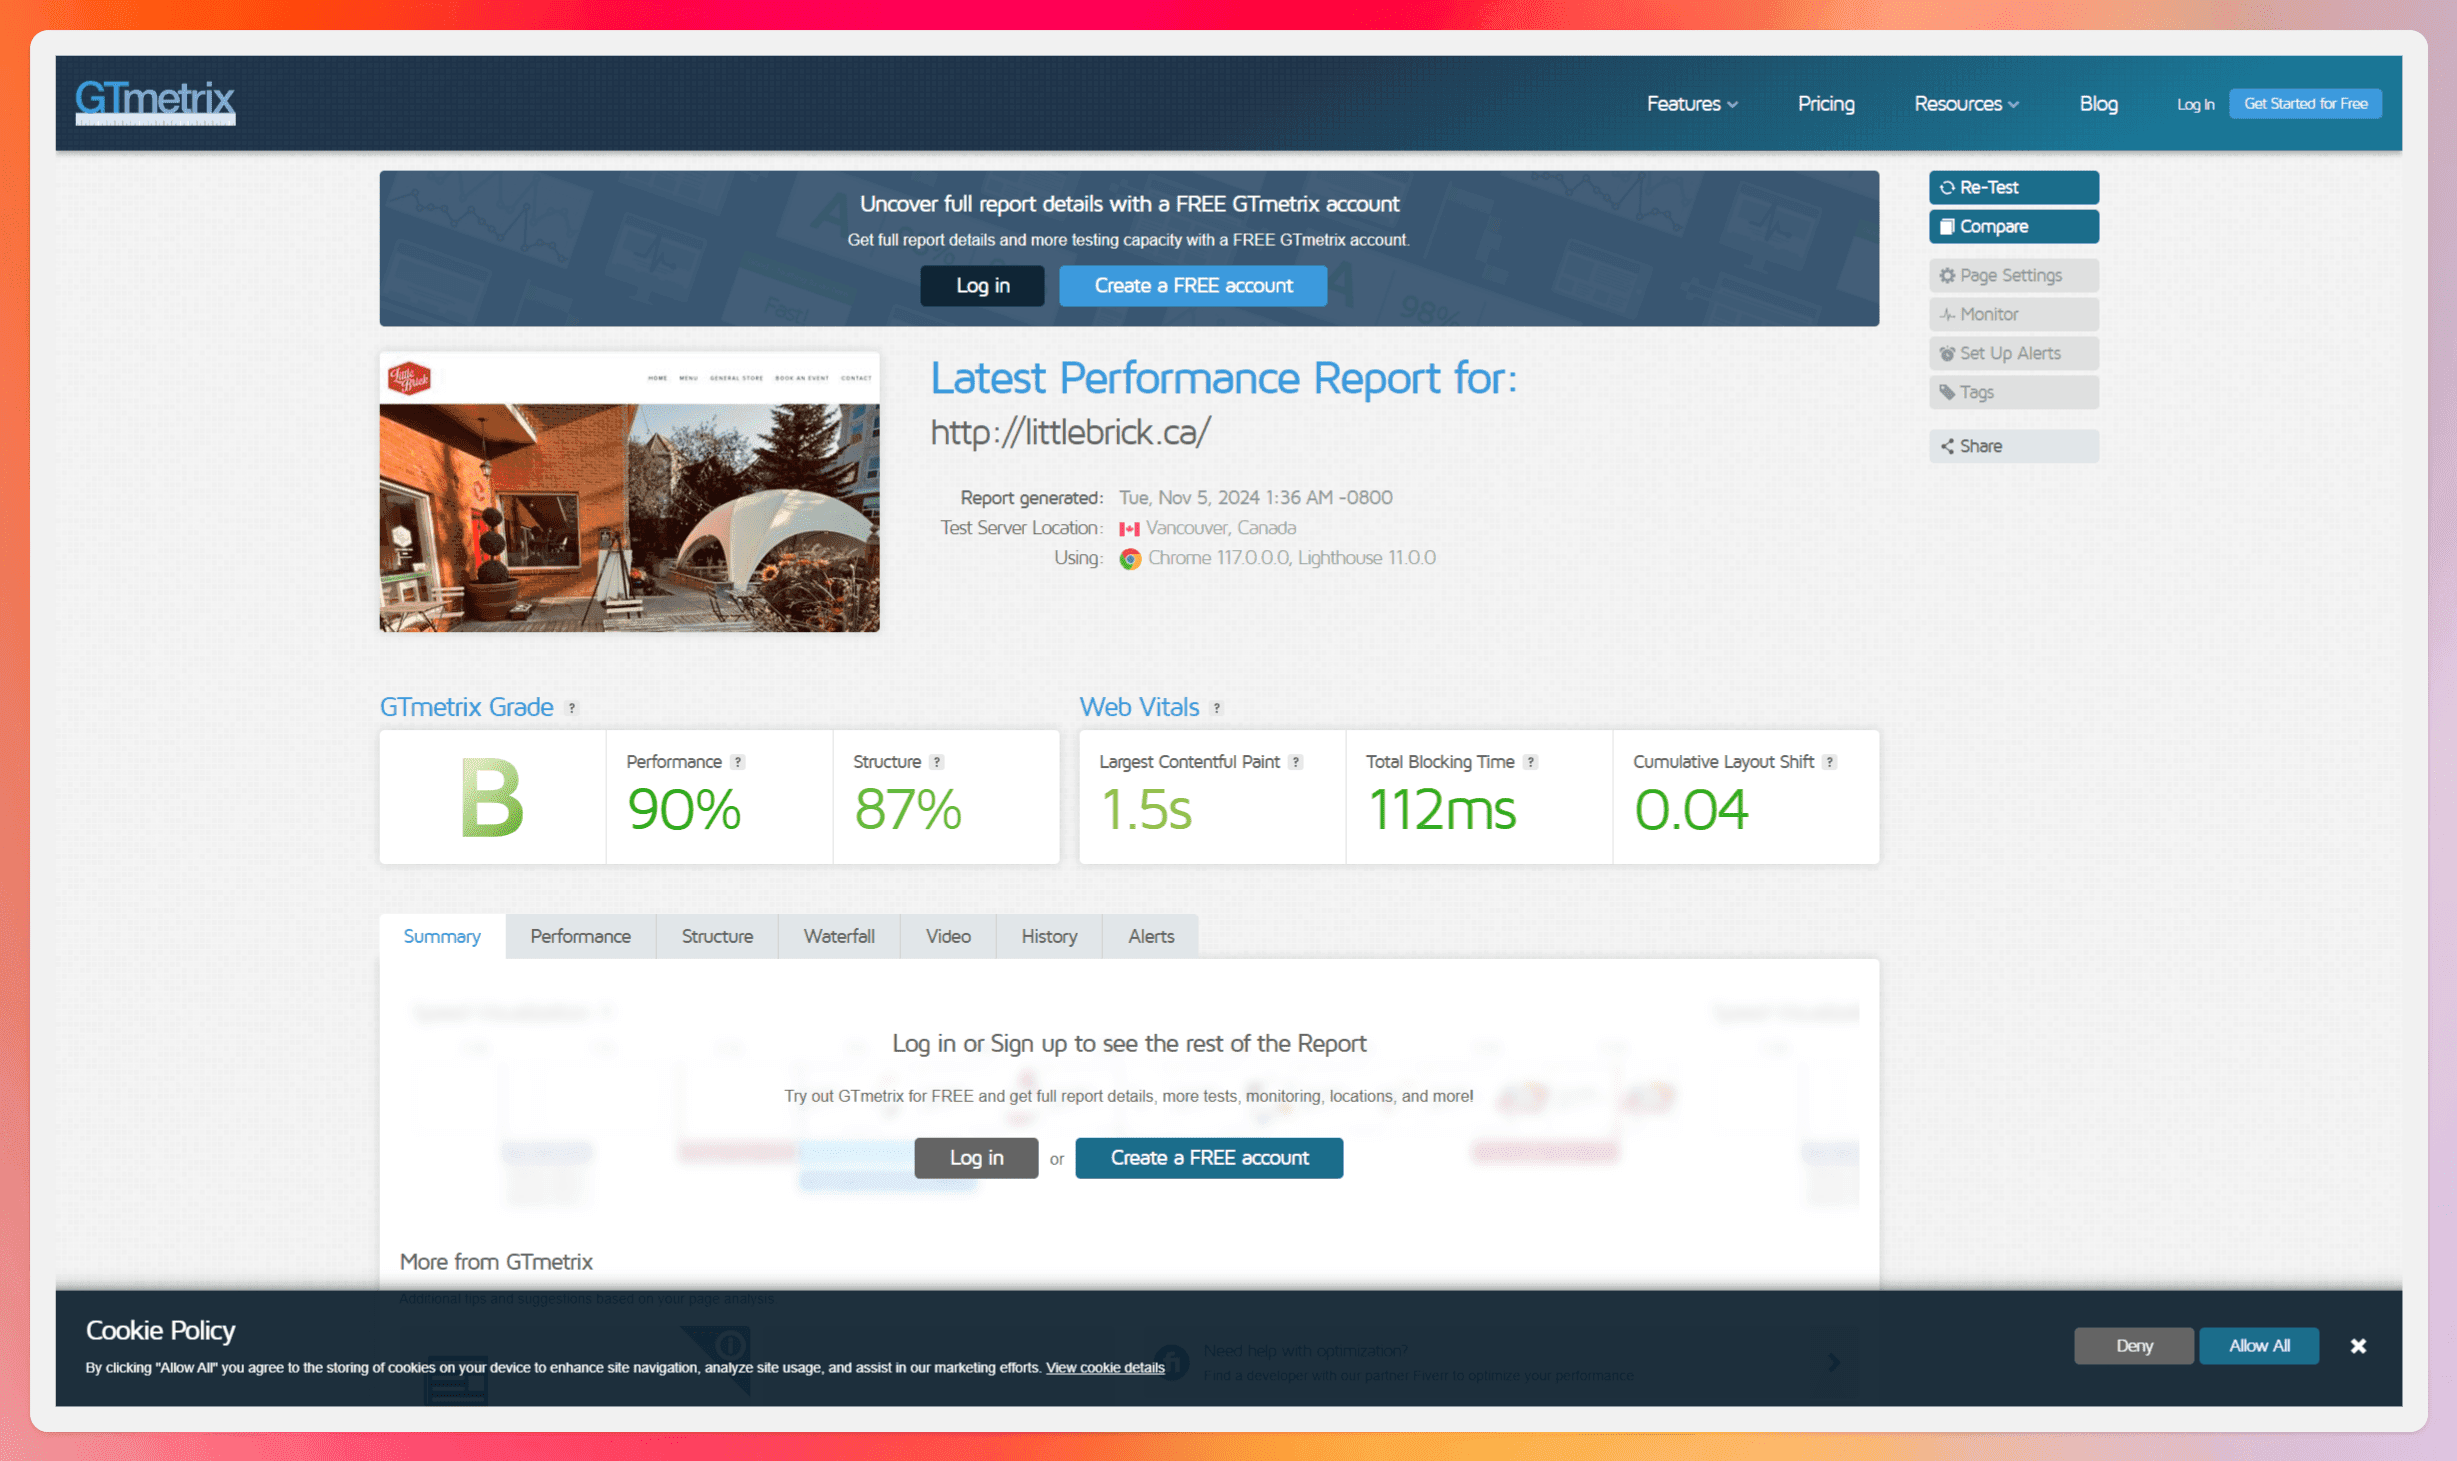
Let's break down the stats.
- GTmetrix Grade: This is an overall score (A to F) that GTmetrix assigns to your webpage based on its performance. It's a weighted average of your Performance and Structure scores. Think of it as a general "health" indicator of your page's speed and user experience.
- Performance: A percentage score based on how well your page performs on key metrics related to loading speed and user experience. GTmetrix uses Google's Lighthouse to analyze your page and generate this score. Higher is better!
- Structure: A percentage score evaluating how well your page is optimized for best practices in web development. This includes things like appropriately sized images, efficient code, and browser caching. Again, aim for a higher score.
- Largest Contentful Paint (LCP): This metric measures how long it takes for the largest content element (image, text block, video) on your page to become visible in the user's browser. A fast LCP helps users perceive your page as loading quickly. Aim for an LCP of 2.5 seconds or less.
- Total Blocking Time (TBT): TBT quantifies the total amount of time that a page is "blocked" from responding to user input (like mouse clicks or scrolling) during the loading process. Long tasks (bits of JavaScript that take a while to run) are the main culprits. A lower TBT means a more responsive page. Aim for a TBT of 300 milliseconds or less.
- Cumulative Layout Shift (CLS): CLS measures how much the visual elements on your page shift around unexpectedly as it loads. Think of those annoying moments when you're about to click something, and it suddenly moves! A lower CLS score indicates better visual stability. Aim for a CLS score of 0.1 or less.
All of these are important and come together to give your website an overall grade.
To get an idea of how good or bad your website is, check the grade.
These scores, represented as grades (A, B, C, etc.) and color-coded (green, orange, red), give you an overall picture of your website's performance.
PageSpeed score is based on Google's PageSpeed Insights rules, while YSlow score is based on Yahoo! 's YSlow rules. Both analyze various aspects of your website, such as image optimization, caching, and code efficiency.
Now, here's a little secret: Don't get too hung up on achieving perfect scores. While A's are fantastic, the real goal is to identify and address any major issues slowing down your website.
How to Improve Your Website with GTmetrix Insights

Obviously these metrics are great, but they mean nothing if you don't take action and actually work on improving your website.
And here's the deal: even small tweaks can make a big difference in your website's speed and overall performance. Here are a few things you can do to help, although what you'll need to do will depend on the feedback you get in your report.
Image Optimization
Think of your website like a delivery truck. The heavier the load, the longer it takes to reach its destination.
Images are often the biggest culprits when it comes to website bloat. Large image files can significantly slow down your page load times, leading to frustrated visitors and higher bounce rates.
Thankfully, there are plenty of ways to optimize your images without sacrificing quality. Here are a few tips:
- Compress, compress, compress! Use tools like TinyPNG or ShortPixel to reduce image file sizes without noticeable quality loss.
- Resize images to the appropriate dimensions. Don't upload a massive image if it is only displayed as a small thumbnail.
- Choose the right file format. JPEGs are generally best for photographs, while PNGs are better for graphics with transparency.
Caching Strategies
Ever noticed how some websites load faster the second time you visit them? That's because of caching. Caching is like storing a copy of your website in the visitor's browser, so the next time they visit, the page loads much faster.
There are different types of caching, including browser caching, server-side caching, and CDN (Content Delivery Network) caching.
Each type has its own benefits, and implementing a combination of caching strategies can significantly boost your website's performance.
Minification and Code Optimization
Behind the scenes, your website is made up of lines of code (HTML, CSS, and JavaScript). Minification is the process of removing unnecessary characters from this code (like whitespace and comments) without affecting its functionality.
Think of it like packing a suitcase. By removing the extra "fluff," you can fit more into the same space. Minifying your code can reduce file sizes and improve your website's loading speed.
There are various tools and plugins available to help you minify your code. Just be careful not to over-optimize, as this can sometimes lead to compatibility issues.
By implementing these optimization techniques, you can make significant improvements to your website's speed and performance. Remember, every second counts!
The Importance of a Well-Structured Website

Now, here's something important to keep in mind: GTmetrix is a fantastic tool, but it can't work miracles. Think of it like a talented mechanic – they can tune up your car and get it running smoothly, but they can't rebuild the engine from scratch.
Similarly, GTmetrix can help you optimize your website's performance, but it can't fix underlying structural issues.
If your website is built on a shaky foundation (think messy code, inefficient design, or outdated technology), you'll likely hit a performance ceiling, no matter how much you optimize.
That's why it's crucial to invest in a well-structured website from the get-go. A solid foundation ensures that your website is not only fast but also scalable, secure, and easy to maintain.
If you're starting a new website or struggling with an existing one, it might be worth considering professional website development or optimization services. A skilled web developer can help you create a website that's not only visually appealing but also optimized for performance from the ground up.
A Handy Alternative to GTmetrix
If you're finding that GTmetrix isn't really that helpful or it's a bit overwhelming, don't worry; I'll get you. The app is built with SEO and developer experts in mind, and it doesn't hold back on the jargon because of it.
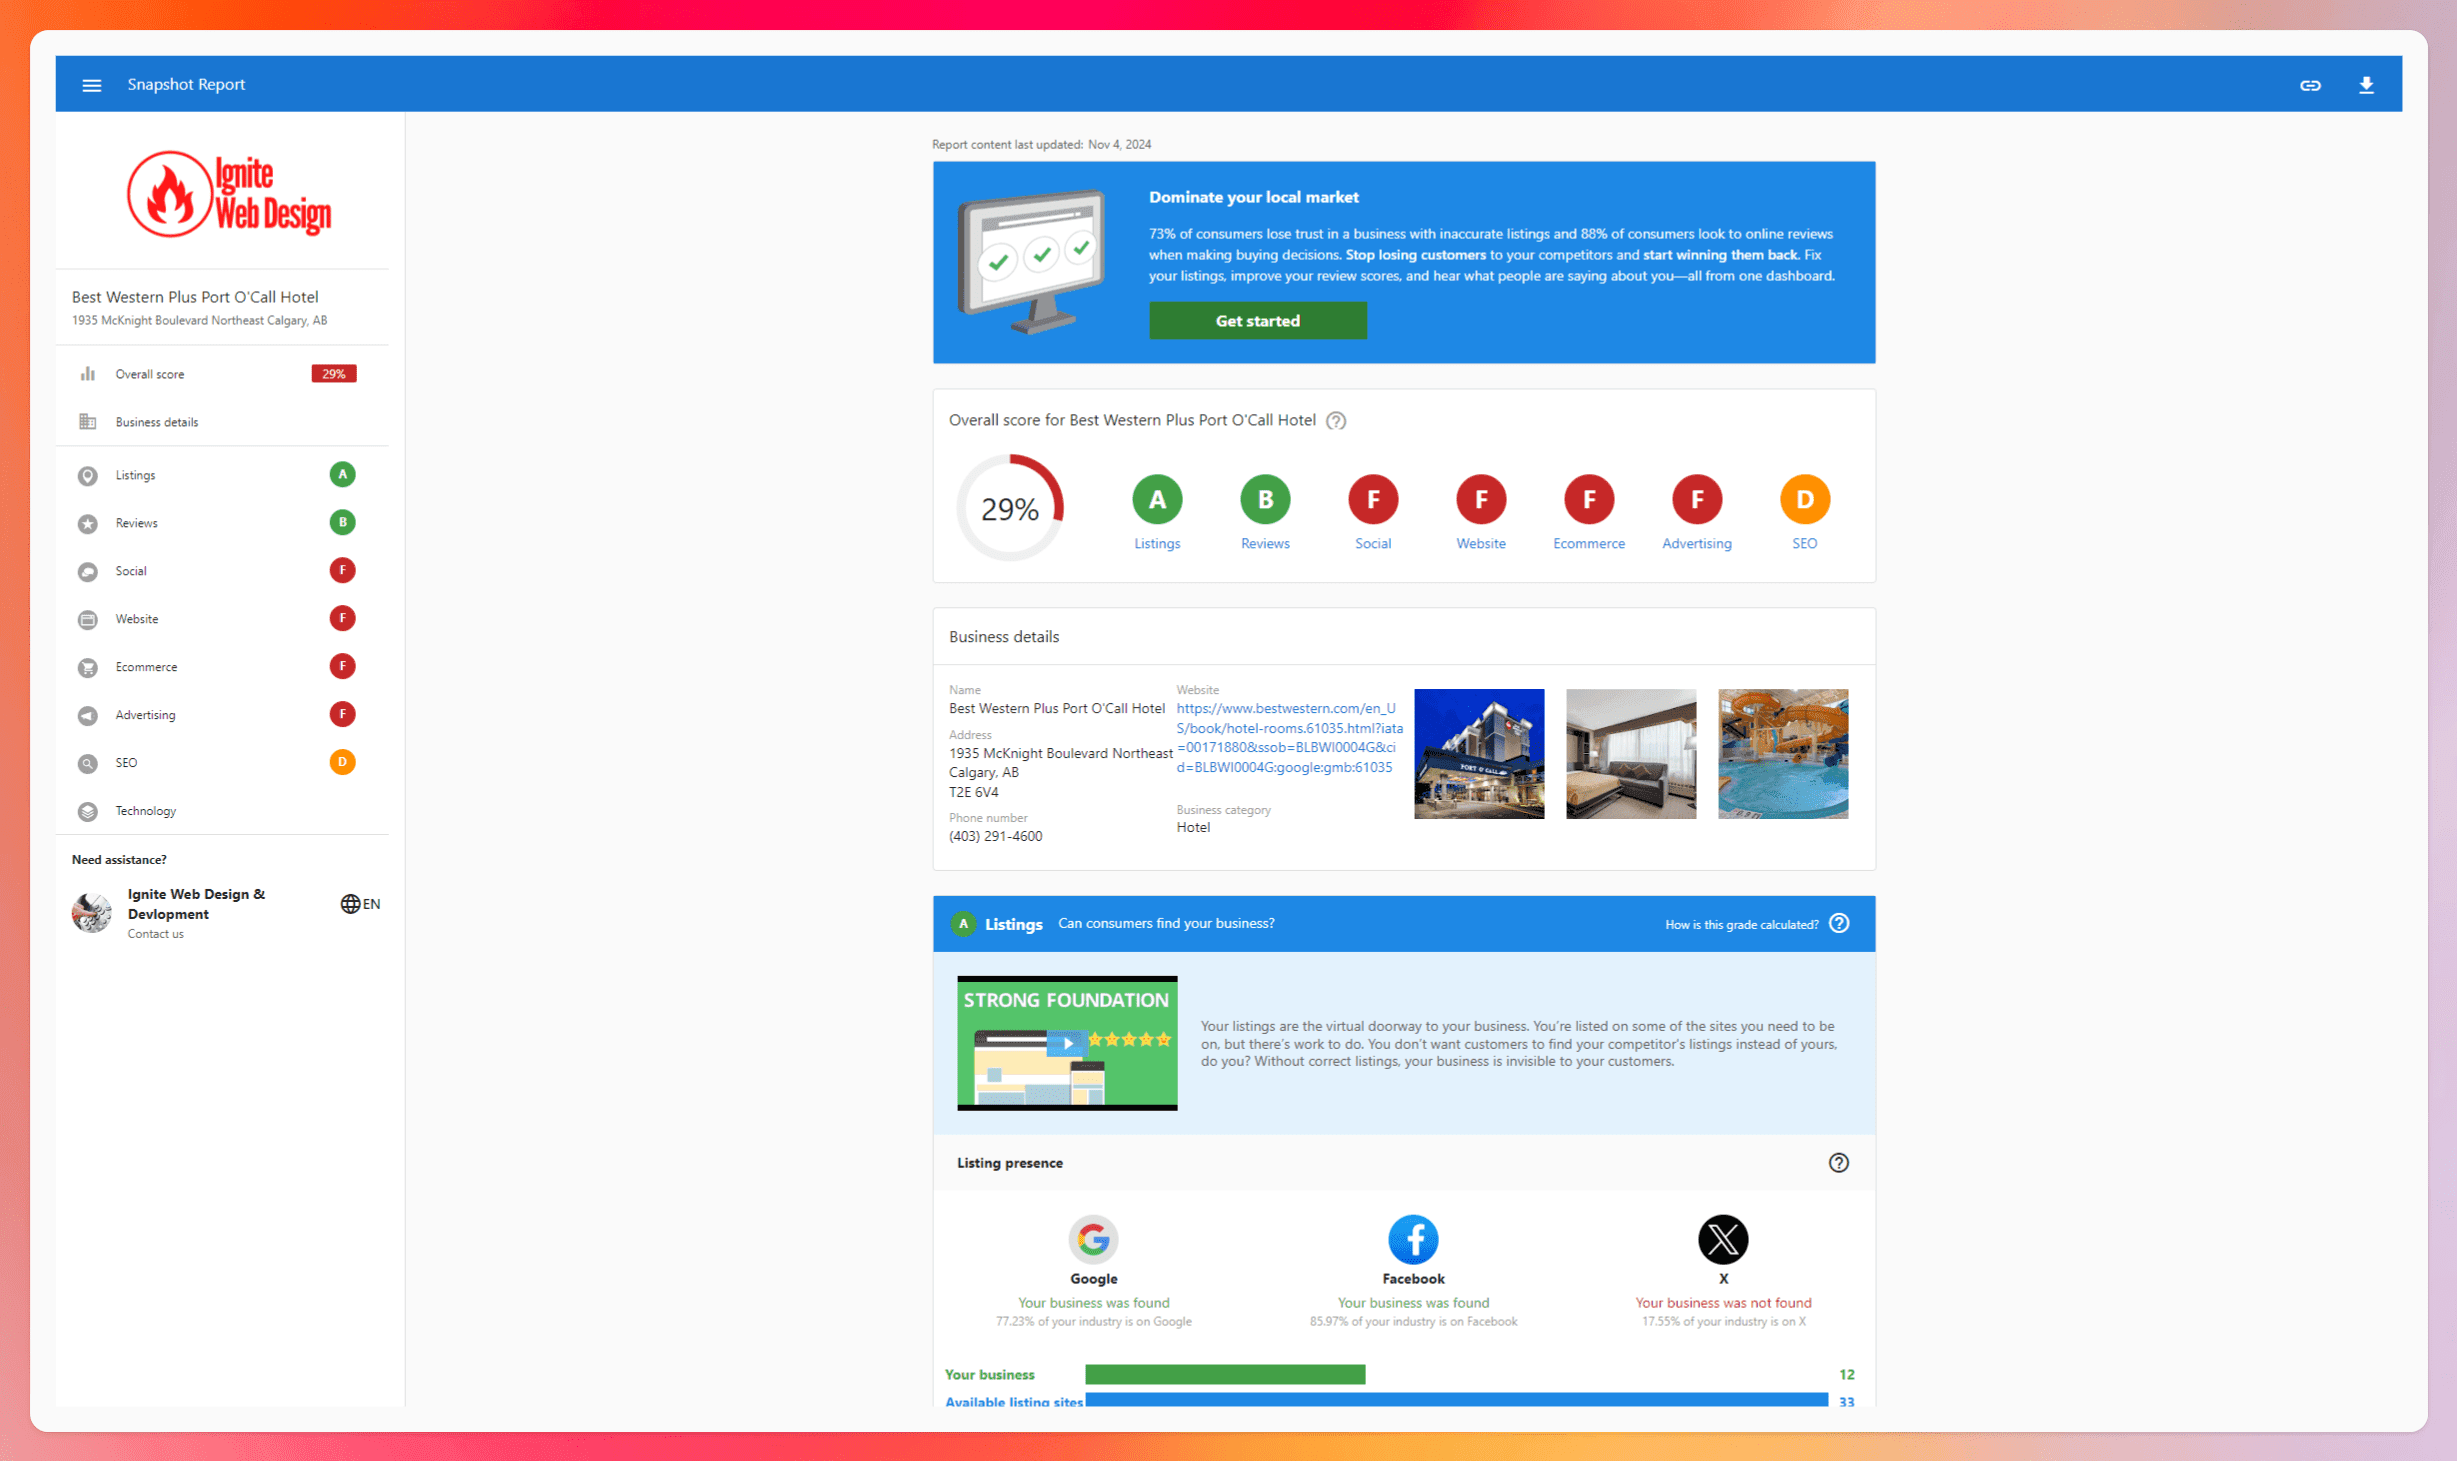
If you're looking for a bit more of a user-friendly experience, we built our own solution here at Ignite Web Design.
Just pop in your website's URL here, and you'll get back a comprehensive report filled with easy-to-understand metrics and data points that clearly explain what's good, what's bad, and what can be improved.
